

Skip to content

Start with the Power BI groundwork already done.

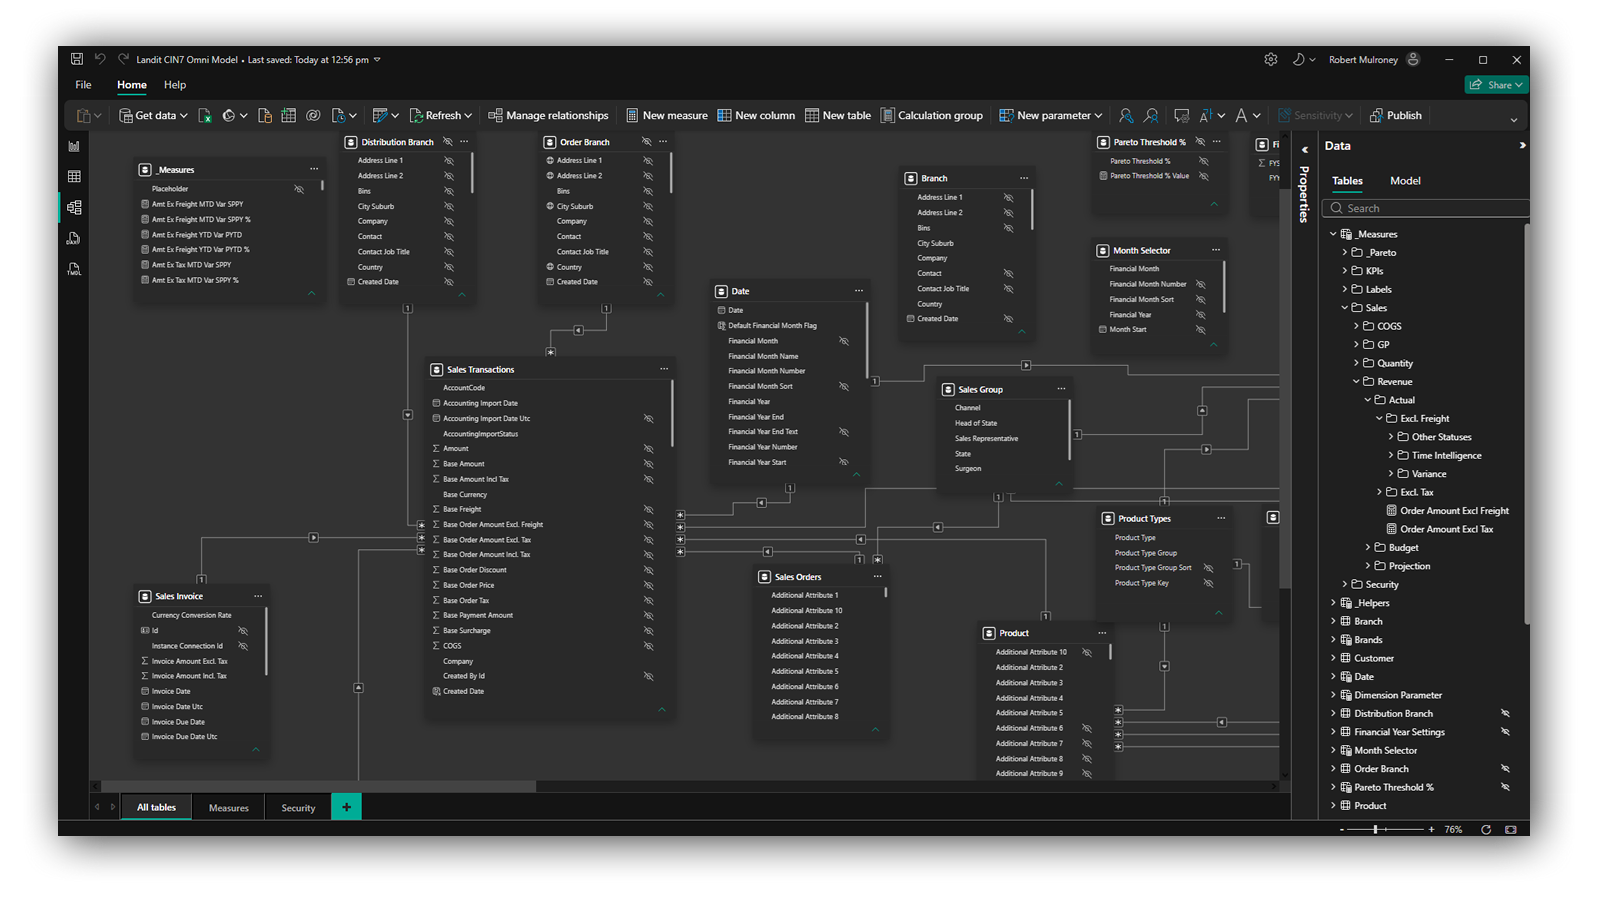
Landit gives you a ready-made Power BI model with relationships, measures and common calculations already built, so you can spend more time tailoring reporting to your customer's requirements.

powerbi_model

Don't start with a blank canvas

Building a Power BI solution normally means creating the data model behind it — defining relationships, building measures and configuring time-based calculations before you can get to the customer's dashboards.

Landit gives you that foundation ready-made, reducing the setup work required before you can start tailoring the solution around the customer's reporting requirements.

  • Relationships built

    The connections between reporting data are already defined.

  • Measures & calculations included

    Common reporting logic is ready to use.

  • Structured for reporting

    The model provides a consistent foundation for the customer's Power BI reporting.

Start with reporting that's already useful

Landit's sample dashboards give you a practical starting point for common customer reporting requirements, built on the ready-made Power BI model.

Use them as delivered where they meet the requirement, adapt existing reports and visualisations, or use them as the foundation for reporting tailored to the customer.

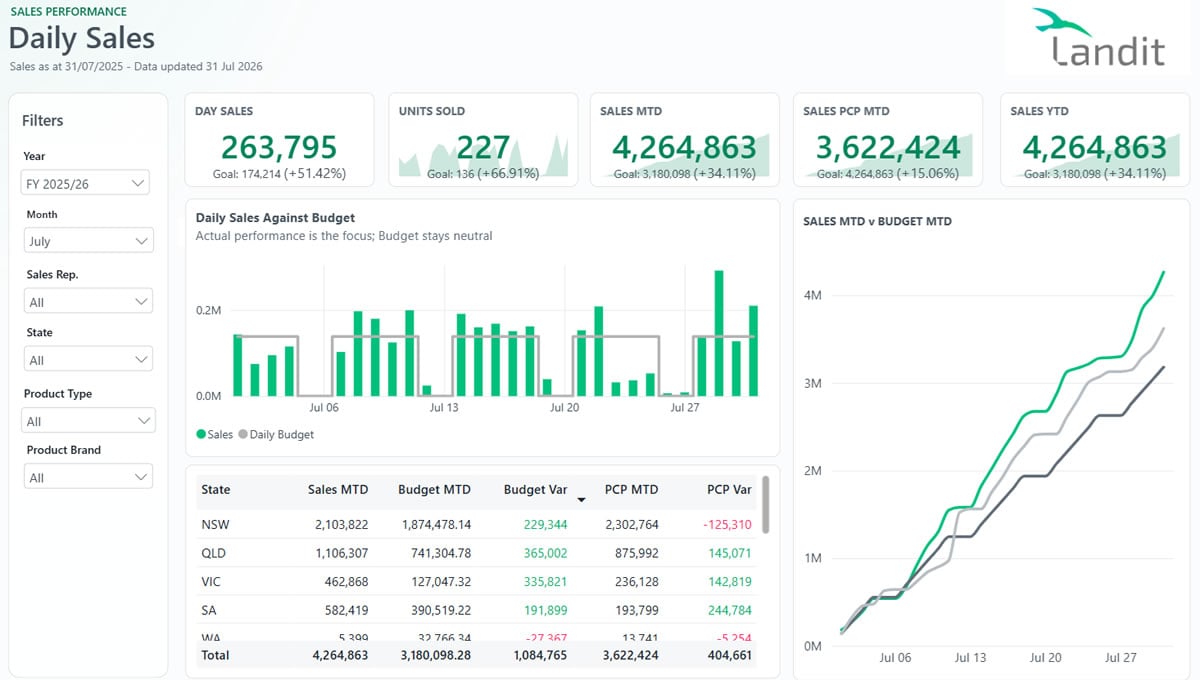
powerbi_dailysales_dashbaord

Daily Sales Performance

Don't wait until the end of the month to discover missed opportunities. Stay ahead of your sales targets with up-to-date visibility into revenue, budgets and performance. Interactive charts, KPIs and regional breakdowns reveal what's working and where action is needed. Act sooner, correct course faster and capture more revenue, turning everyday sales data into measurable business results.
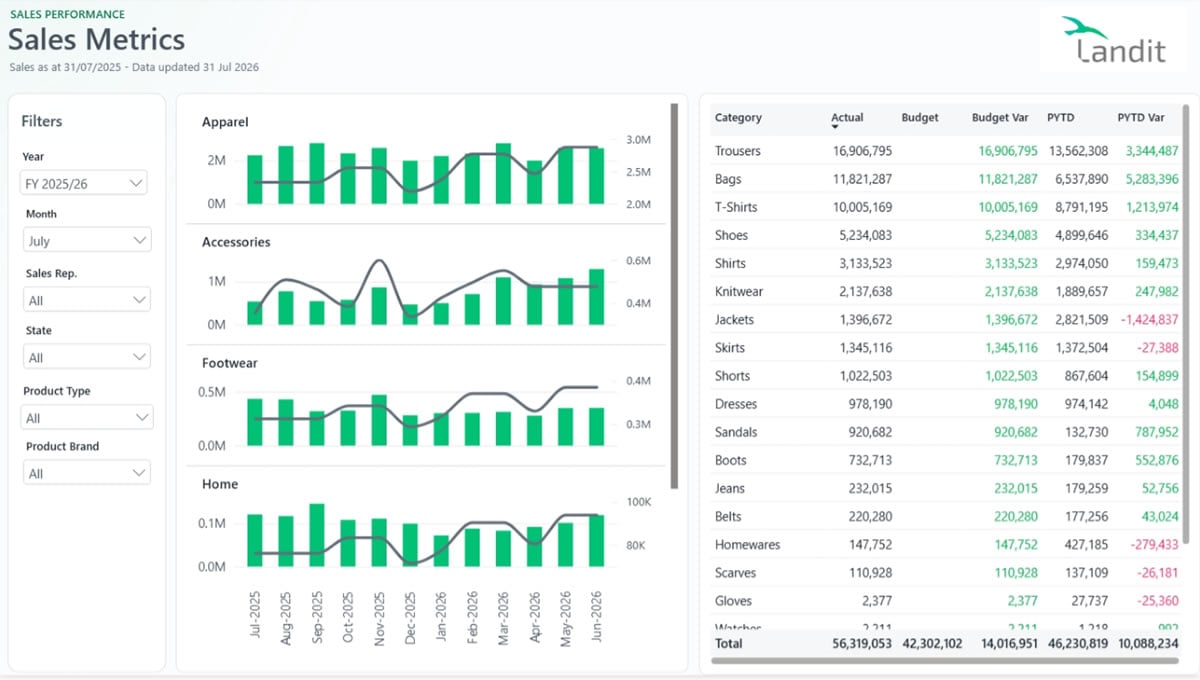
powerbi_category_dashboard

Product Category Sales Analysis

Understand which product categories are driving revenue. Compare actual sales against budgets and prior-year performance, while visualising sales trends across categories to identify growth opportunities and products requiring attention.
powerbi_waterfall_dashboard

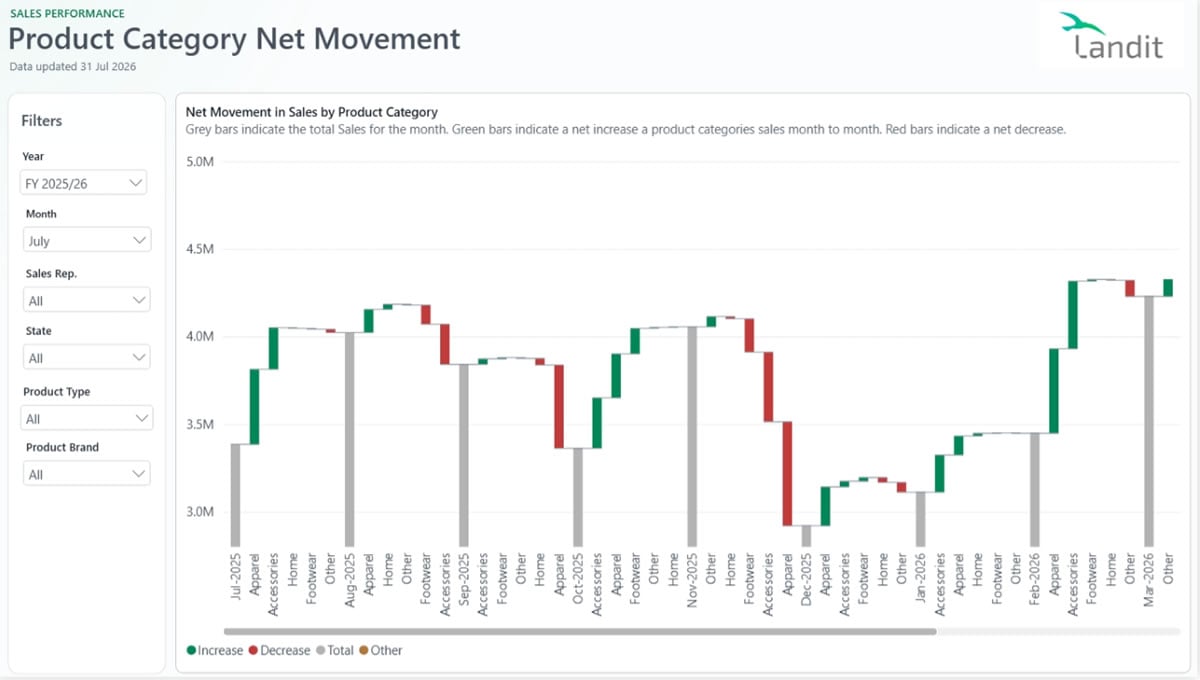
Product Category Net Movement

Spot sales trends early and act before opportunities are lost. Identify which product categories are driving growth or dragging down revenue, and understand how performance is changing over time. Increase stock of high-demand products, reduce investment in declining categories and target sales efforts where they’ll deliver the greatest return. 

Tailor the solution to the customer

Landit's Power BI model and sample dashboards give you a working starting point, while leaving you free to shape the solution around each customer's requirements.

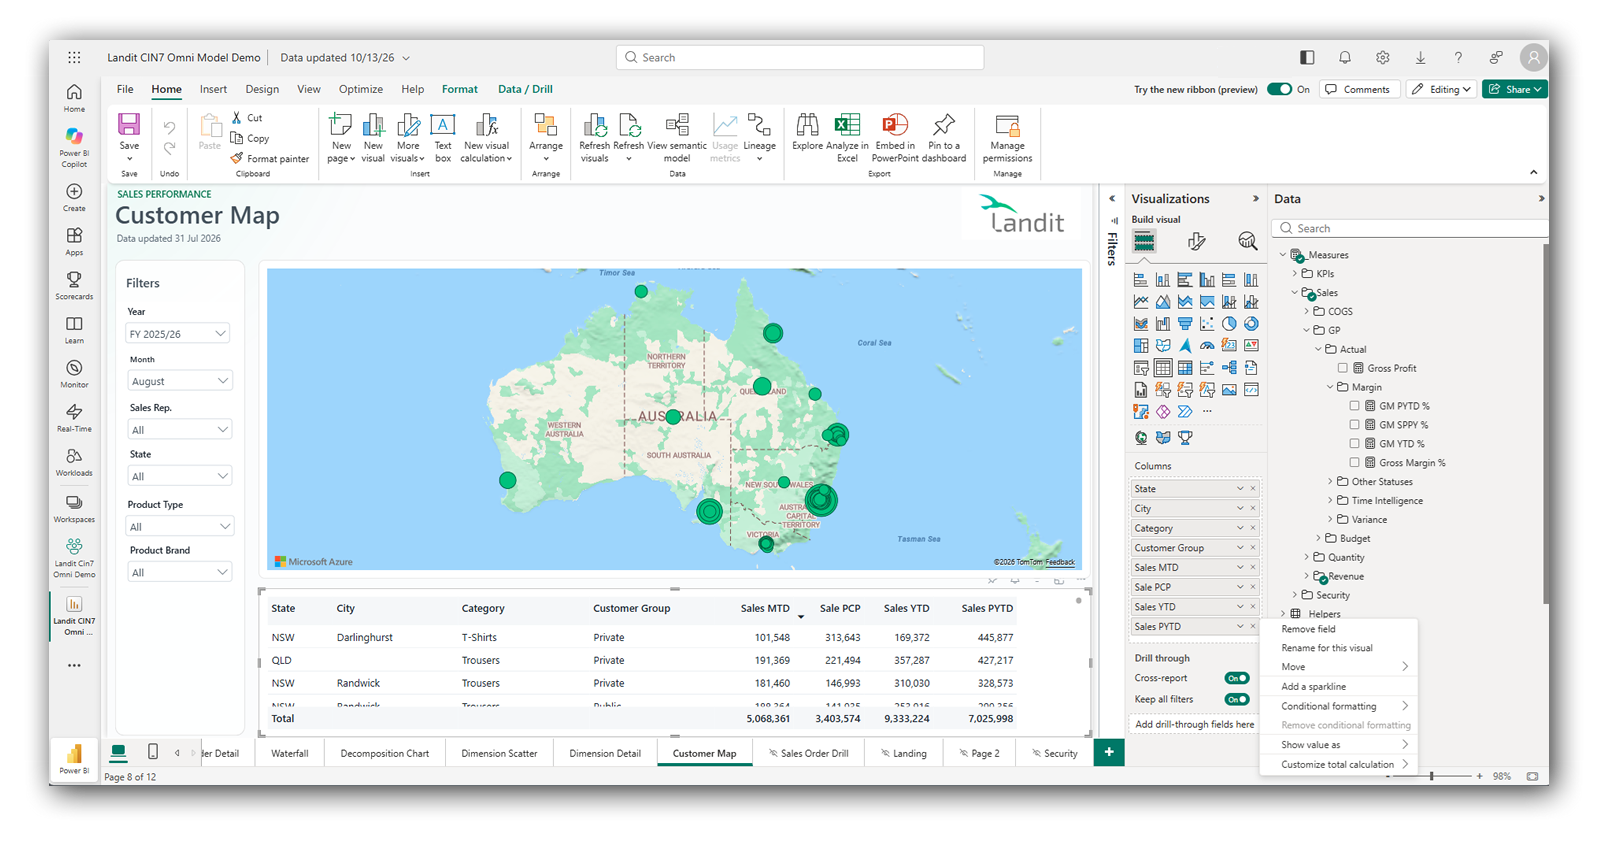
Extend the model with additional measures, add or modify pages and visualisations, and develop business-specific reporting using the full capabilities of Power BI.

Start with the work Landit has already done, then focus your Power BI expertise where it adds the most value — understanding the customer's requirements and tailoring the reporting around them.

powerbi_edit

Leave the data plumbing to Landit

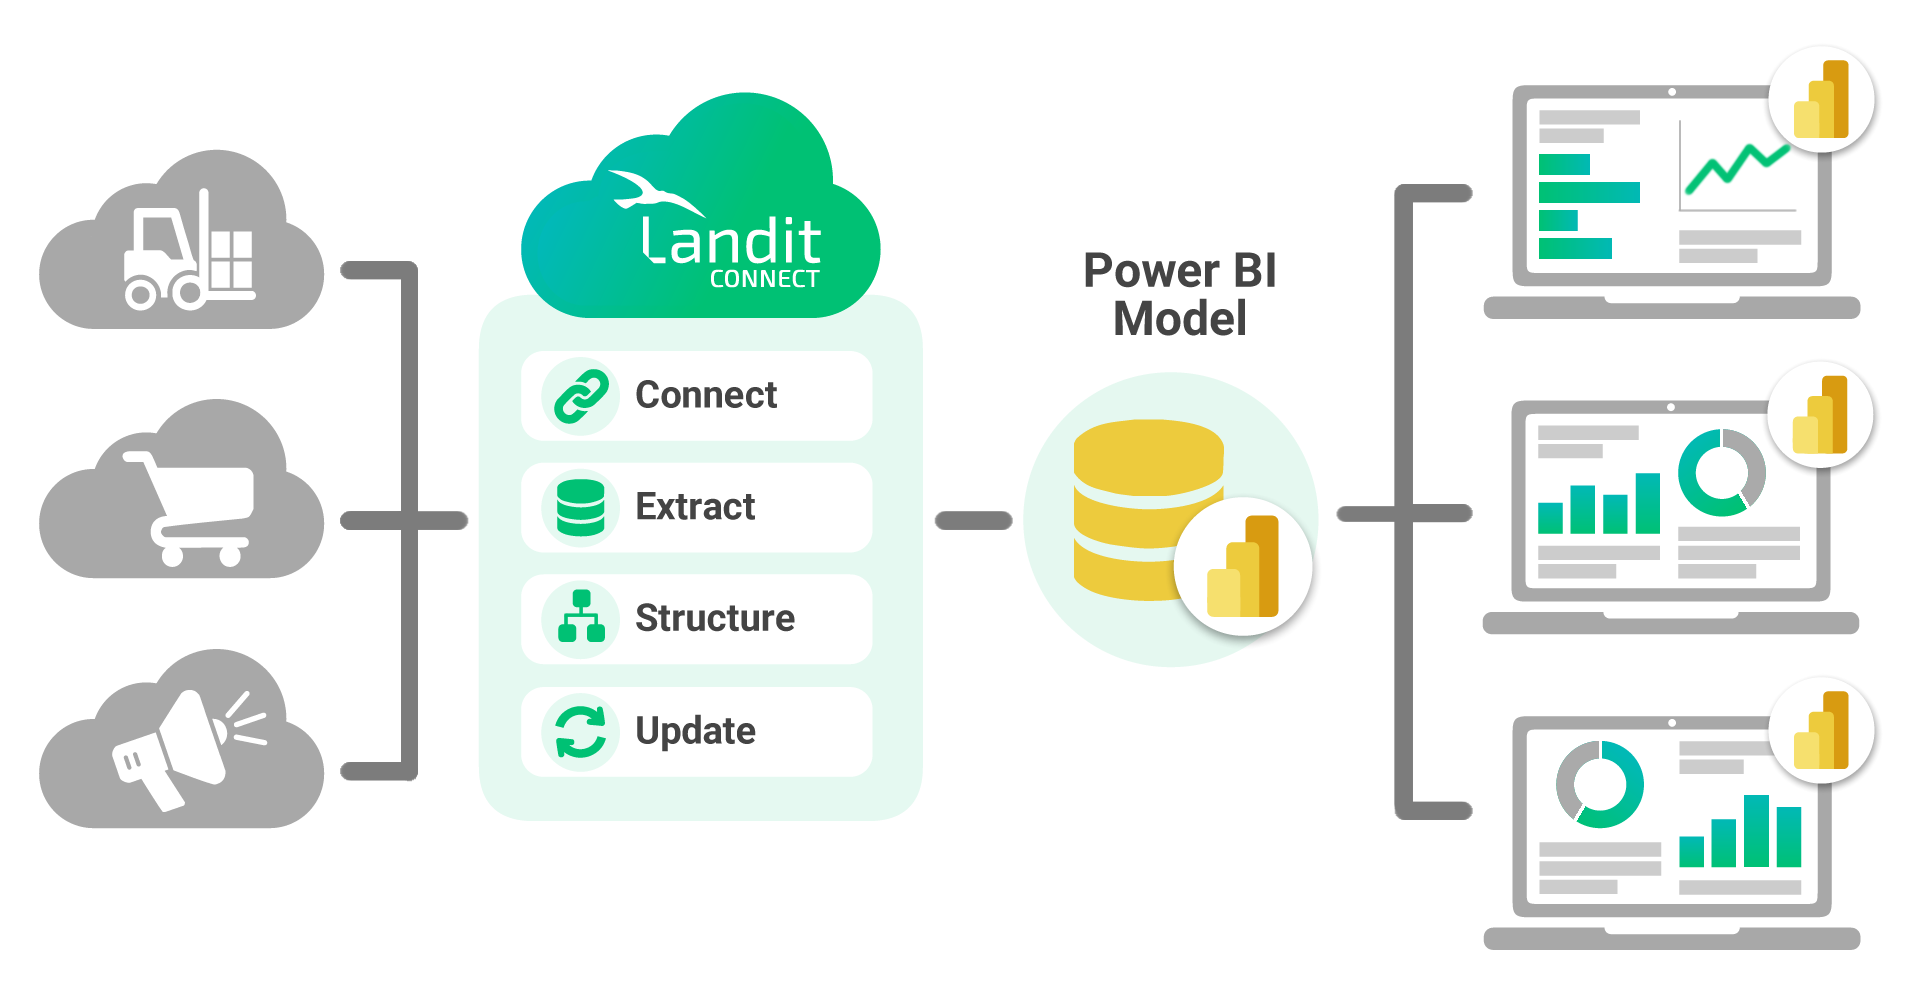
Connecting Power BI directly to operational systems can mean working with source-system APIs, building data pipelines and maintaining those integrations as systems and data change.

Landit manages the source-system connection, data extraction and ongoing updates, giving you a structured data layer to build the customer's Power BI solution on.

You can focus on the reporting solution rather than building and maintaining the infrastructure that feeds it.

landit_powerbi_inforgraphic_v1_4

Build once. Apply across customers.

Landit presents data from the same source system through a consistent data model across customer instances.

That means Power BI reports, model changes and other reporting work you build on top of the Landit model can be applied to other customers using the same source system — giving you a repeatable foundation rather than starting again with every implementation.

  • Consistent data model

    Work with the same underlying structure across customer instances using the same source system.

  • Reusable reporting

    Apply Power BI reports and model changes you've already developed to other Landit customer instances.

  • Build your own capability

    Develop reporting patterns and solutions that can be reused and refined across the customers you support.

Control the data you make available

Create a table in Landit's Query Builder, save it and publish it as a custom OData endpoint. For Power BI implementations, this lets you define the specific dataset the solution needs rather than exposing the broader Landit dataset.

  1. Landit data

    Start with the data available through your customer's connected source systems.

  2. Query Builder

    Select the data you need, apply filters and shape the dataset around your reporting requirements.

  3. My Table List

    Save your query as a custom table, then find and manage it in My Table List.

  4. Publish as OData

    Publish the saved table as a custom OData endpoint, making your selected dataset available to Power BI.

  5. Power BI

    Connect Power BI to the custom endpoint and use the dataset in your model and reports.

Power BI for Partners FAQs

What does Landit provide for a Power BI implementation?

Landit provides a structured data layer, a ready-made Power BI model with established relationships, measures and calculations, and sample dashboards.

It also manages the source-system connections, data extraction and ongoing updates, reducing the amount of integration and modelling work required before you can focus on the customer's reporting requirements.

Do I need to build or maintain the source-system integrations?

No. Landit manages the connection to supported business systems, including data extraction, preparation and ongoing updates.

This means you can build the Power BI solution against Landit's structured data layer rather than developing and maintaining the underlying source-system API integrations yourself.

Is the Landit data model consistent across customers?

Yes. Customers using the same supported source system are presented through substantially the same Landit data model.

For example, Cin7 Core customers use the same underlying dataset definitions, providing a consistent structure for Power BI implementations across different customer instances.

Can I reuse Power BI reporting across customers?

Yes. Power BI reports and model changes built against Landit's standardised data model can be applied to other compatible Landit customer instances.

This allows you to develop reusable reporting assets and implementation patterns rather than rebuilding the same solution for each customer.

Customer-specific configuration and reporting requirements may still need to be addressed.

How does Power BI access Landit data?

Power BI accesses Landit's structured data through OData.

The entities exposed through OData use the same dataset definitions available through Landit Excel and the web-based Query Builder, providing a consistent data structure across reporting environments.

Can I control which Landit data is exposed to Power BI?

Yes. You can create a table using Landit Excel or the full-screen Query Builder, save it to My Table List, and submit it for publication as a custom OData endpoint.

This allows you to define the specific subset of data made available to Power BI or other Landit data consumers, rather than exposing the broader dataset.

Spend more time on the customer solution.

See how Landit can reduce the groundwork behind a Power BI implementation and give you a reusable foundation for customer reporting.